Sales Overview Dashboard |
Top Previous Next |


Sales Dashboard
The Sales Dashboard provides a quick, real-time overview of sales performance, profitability, budgets, and sales pipeline activity.
•Current sales performance against previous periods
•Actual sales against budget
•Profitability and net profit trends
•Sales pipeline activity
The Sales Dashboard is divided into three sections:
1. Sales Overview
2. Sales Budget
3. Sales Pipeline
Sales Overview Section
Go to: File > Dashboard > Sales Overview
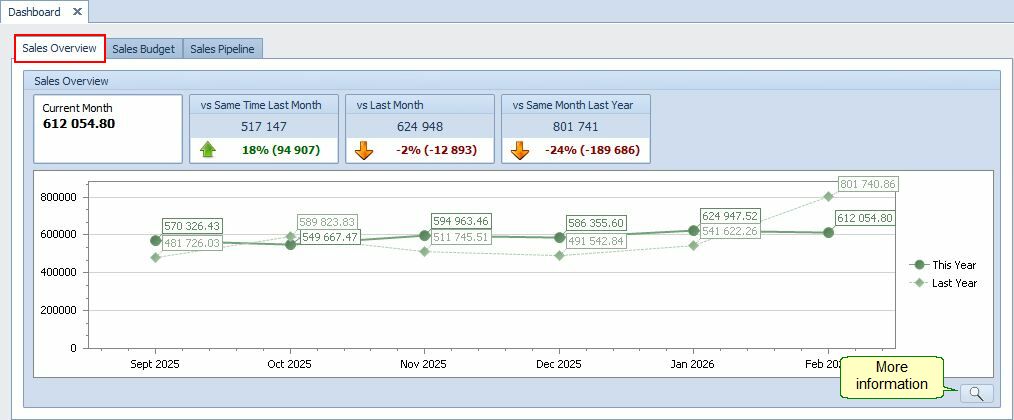
The Sales Overview section provides a comparison of current sales against previous periods. It also shows the percentage increase or decrease between the periods.
Comparison |
Description |
Current Month |
Sales for the current month |
Same Time Last Month |
Sales for the equivalent period last month |
Last Month |
Total sales for the previous month |
Last Month Last Year |
Sales for the corresponding month in the previous year |
6-Month Sales Trend
The 6-Month Trend Graph provides a visual comparison of sales over the past six months.
It displays:
•Sales for the last six months
•Sales for the same six-month period in the previous year
This makes it easy to identify year-on-year sales trends and changes in performance.
Note: For an in-depth analysis of sales, go to:
• Ledger > Statements > Statements Over Time - In-depth analyzes of Sales, Expenses, Gross Profit Margin (GP%) as well as Nett Profit Margin %
• Stock Items > Stock Turnover - Breakdown per stock items
• Stock Items > Stock Turnover > Analysis - Summary of the breakdown per stock items
Sales Budget Section
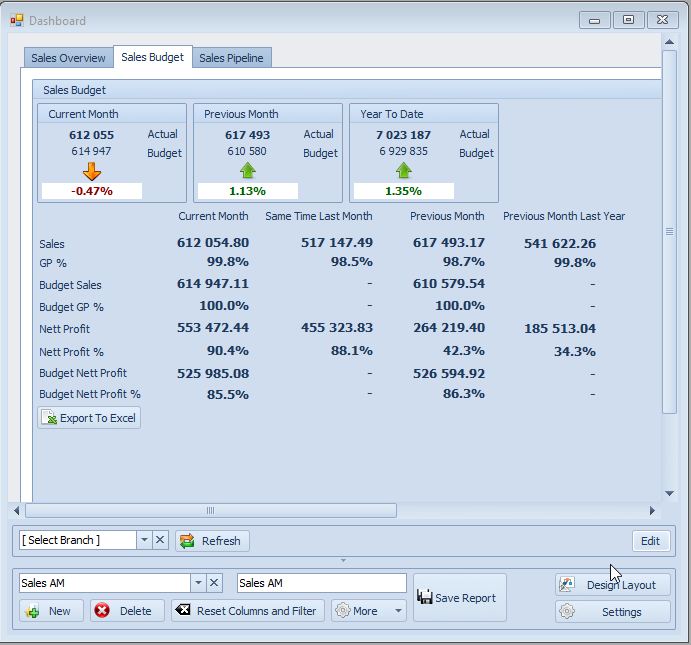
The Sales Budget section compares actual sales and profitability against the budget.
Go to: File > Dashboard > Sales Budget
The comparison is shown for:
•Current Month
•Previous Month
•Year to Date
Example Display
Example
Current Month |
Previous Month |
Year To Date |
|
Actual |
50 000 |
50 000 |
545 600 |
Budget |
50 000 |
57 000 |
952 000 |
% Difference |
0.00% |
-12.28% |
-42.69% |
The Sales Budget section also display:
•Actual Sales
•GP %
•Budget Sales
•Budget GP %
•Net Profit
•Net Profit %
•Budget Net Profit
•Budget Net Profit %
The Sales Overview information can also be viewed across the following periods:
Name |
Current Month |
Same Time Last Month |
Last Month |
Last Month Last Year |
|---|---|---|---|---|
Sales |
50000 |
50000 |
50000 |
326283.93 |
GP % |
100 |
100 |
100 |
100 |
Budget Sales |
50000 |
|
57000 |
|
Budget GP % |
100 |
|
100 |
|
Nett Profit |
2142.74 |
26796.08 |
24222.14 |
177697.65 |
Nett Profit % |
4.29 |
53.59 |
48.44 |
54.46 |
Budget Nett Profit |
17344.16 |
|
45544.16 |
|
Budget Nett Profit % |
34.69 |
|
79.9 |
|
Note: For an in-depth analysis of income and expenses compared with budget figures, go to: Ledger > Extra > Budget.
Sales Pipeline Section
The Sales Pipeline section provides an overview of current sales activity that may contribute to future sales.
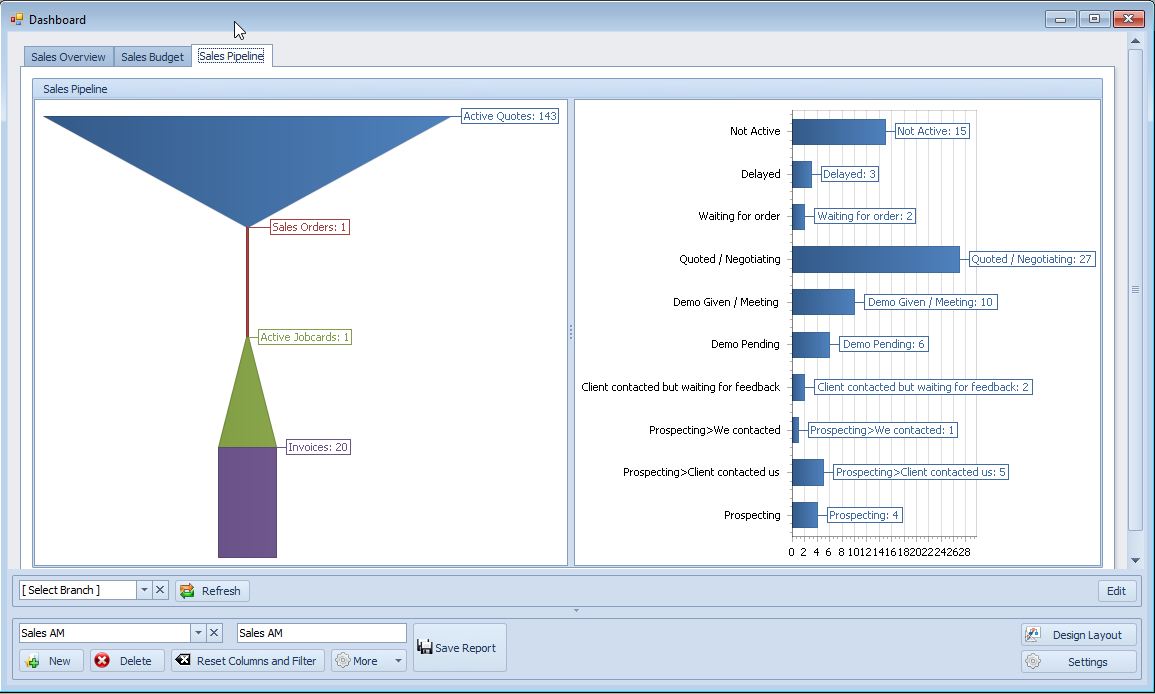
It displays the number of active:
•Active Quotes
•Sales Orders
•Active Job Cards
•Invoices
This gives management a quick view of the current sales pipeline and the transactions moving through the sales process.
