Dashboard
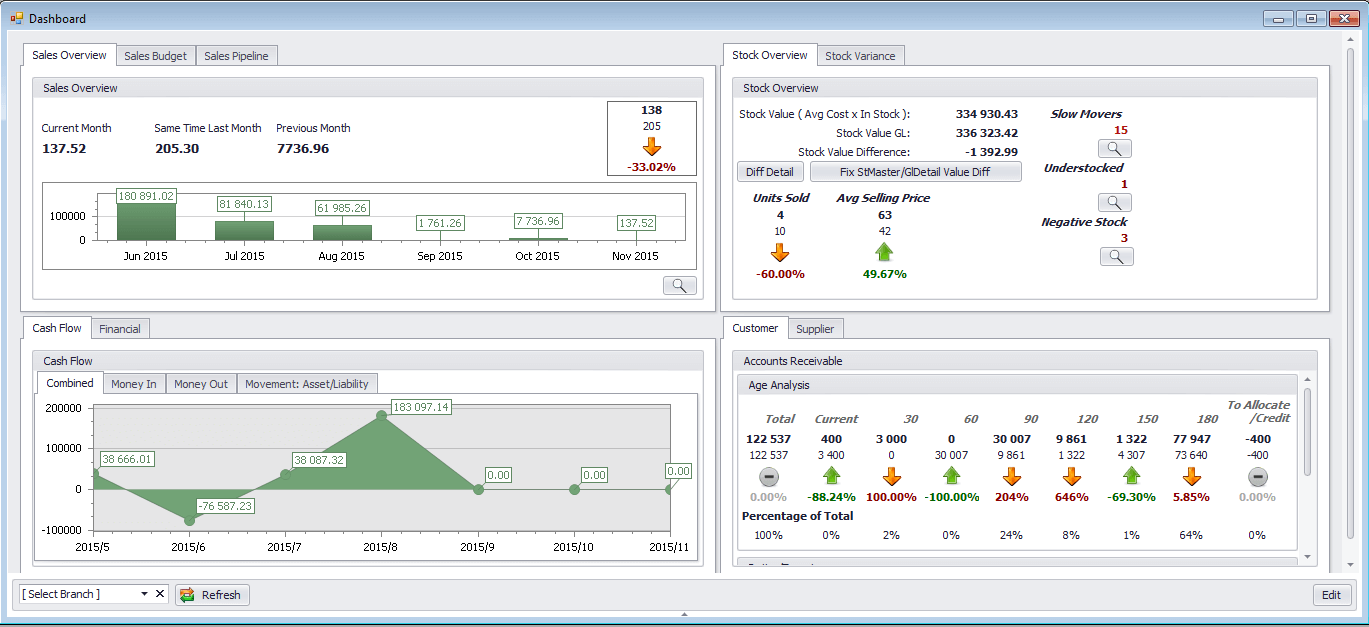
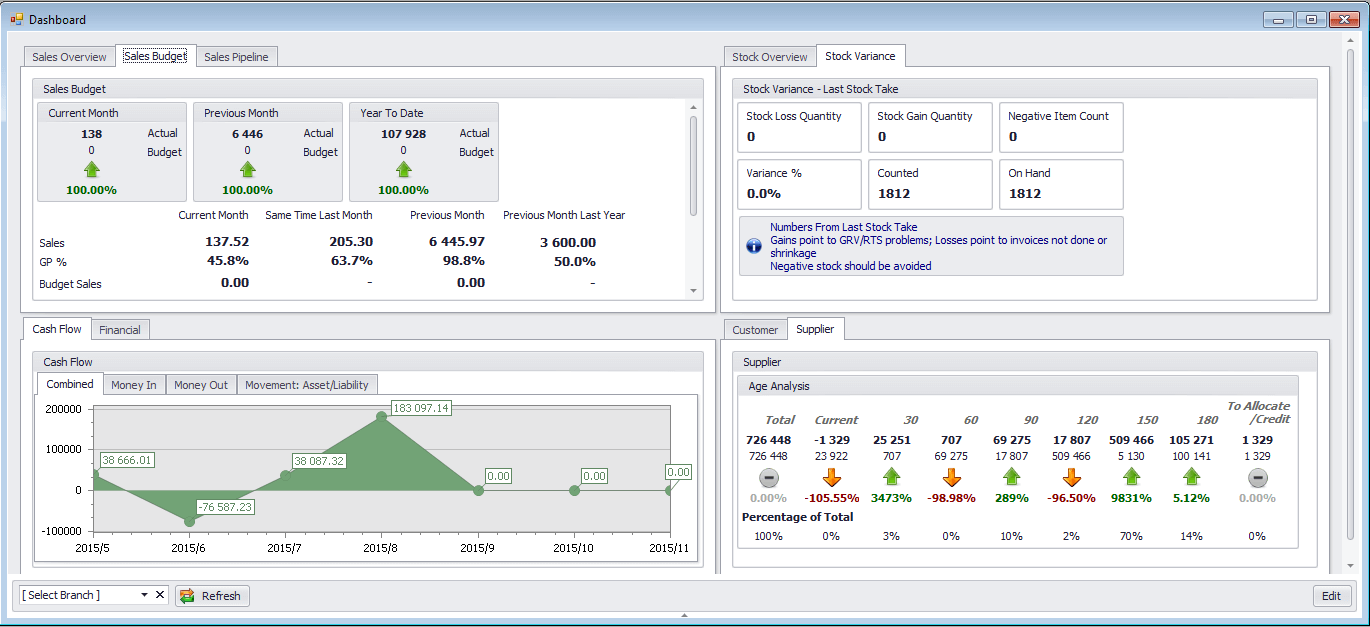
The dashboard is a great tool to view the health of your business. The dashboard gives an overview of all of the key areas that need to be monitored daily. Sales achieved/comparisons, cash flow, stock holding, debtors, creditors, Budgets and a financial rating on one screen.
Features of the Dashboard:
- Sales pipeline summary on the dashboard
- Current to previous month sales comparison
- A rolling 7 month cash flow overview
- Comparison between actual stock value at average cost vs GL stock value
- Analysis on stock units sold
- Average selling price increase or decrease
- Rolling 12 month balance sheet review showing assets
- Rolling 12 month income statement review showing GP
- Debtors & creditors age analysis snapshot
- Customer follow up monitoring by employee
- Sales Budget overview
For a deeper overview consult our help on dashboard.


