Stock Variance |
Top Previous Next |
![]()
![]()
![]()
Stock Variance Dashboard
Go to: File > Dashboard
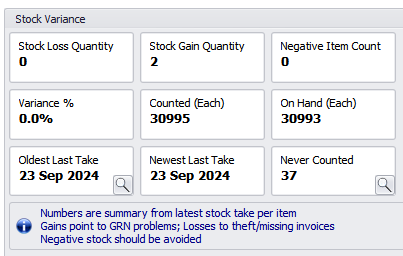
The Stock Variance Dashboard provides a summary of stock differences based on the most last stock take per item.
It compares:
•Counted quantity (physical stock take)
with
•System quantity on hand
Important Notes
•Quantities displayed are shown in Each (base unit).
If you use alternative units or multiple warehouses, values may not match directly unless converted to base units.
•Statistics exclude:
•Items with negative counted quantities
•NSI items
•Service items
•Discount items
•Inactive items
Only Active stock items are included in calculations.
Key Metrics Explained
Stock Loss Quantity - counted quantity less than system on hand
Stock Gain Quantity - counted quantity greater than system on hand
Negative Item Count - stock items where system on hand is below zero (negative stock).
Variance % - (Stock Gain + Stock Loss) ÷ Counted Quantity × 100
Counted - total quantity physically counted (in Each).
On Hand - sum of system on hand (each)
Oldest Last Take - the oldest date any item was counted
Newest Last Take - the most recent date any item was counted
Never Counted - count of items that have never been on a stock take
Stock Extended Lookup contains a Last Stock Take column where you can review items not counted recently.